Retirement Calculator
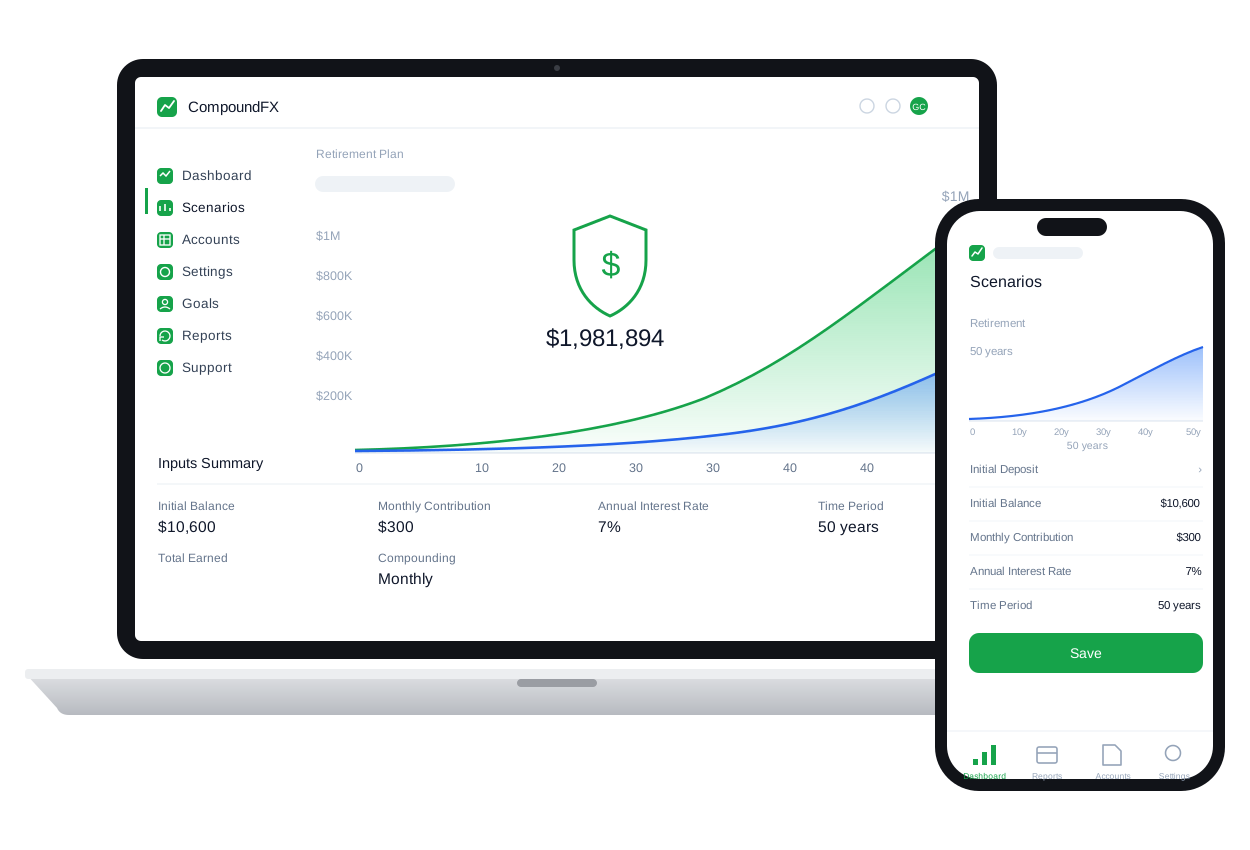
This retirement calculator projects what your savings will be worth at your target retirement age. With $25,000 saved at age 35, $500 added monthly, and a 7% average return, you'd reach about $812,898 by 65 — and the table below the result shows the balance at every age along the way.
Projected Balance at 65
$812,898
Starting from $25,000 at age 35, contributing $500/month at 7%: you deposit $205,000 in total and growth adds $607,898.
When you contribute matters as much as how much
Two savers can deposit identical totals and retire with very different balances, purely on timing. Take the default scenario's saver but let them invest $1,000/month for only half the 30 years. Front-loaded — contributing heavily from 35 to 50, then coasting — the balance at 65 is about $1,105,921. Back-loaded — waiting until 50 to begin the same $1,000/month — produces about $519,875. Same $180,000 out of pocket, roughly $586,046 apart, because front-loaded dollars compound for decades instead of years. The mechanics behind that gap are the subject of The Power of Starting Early.
What this projection deliberately leaves out
This is a savings-growth projection, not a full retirement plan — several things that will shape your actual retirement are intentionally not modeled:
- Taxes. Whether your balance lives in a 401(k), Roth account, or taxable brokerage changes what it's worth to spend.
- Social Security or pensions — income sources that reduce how much your portfolio must supply.
- The withdrawal phase. This tool stops at your retirement date; how long the money lasts afterward is a different calculation.
- Inflation. The result is in future (nominal) dollars. $812,898 thirty years from now will not buy what it buys today — translate it with the inflation calculator and read why the distinction matters.
Keeping those out is a feature: a clean growth number you can reason about beats a black box that mixes six assumptions you can't inspect.
Which expected return should you enter?
Run the projection twice — once conservative, once optimistic — and plan around the gap rather than a single guess. Long-run diversified stock portfolios have historically averaged somewhere in the 6–8% range before inflation, but "average" hides decades that did far better and far worse, and nobody is issued the average. A 5% run tells you the floor your plan should survive; an 8% run shows the upside you shouldn't count on. If the two projections bracket a comfortable retirement, your plan is robust; if only the optimistic one works, the contribution field — not the return field — is where to make changes.
Starting late? The levers still work
A 50-year-old starting from zero has real options — the math is smaller but far from hopeless. Contributing $1,500/month at 7% from 50 to 67 builds about $585,189, of which $279,189 is growth. Late starters also hold levers younger savers don't: peak earning years (and, in many retirement accounts, catch-up contribution allowances), the option to shift retirement by a year or two — each extra working year both adds deposits and gives every existing dollar another year of compounding — and typically lower expenses once children launch. Run your own ages honestly through the calculator above; a real number, even a sobering one, beats a vague worry.
Solve for any variable with Goal Mode
This projection answers 'what will I have at retirement age?' In CompoundFX, Goal Mode also answers the reverse questions — what monthly contribution, what return, or how many working years a target balance requires — and compares scenarios side by side.

Free to download. Optional one-time Pro upgrade. No subscription.